

This blog shows several different ways to visualize data from the tidycensus package for R.
Official websites use .gov
A .gov website belongs to an official government organization in the
United States.
Secure .gov websites use HTTPS
A lock (
) or https:// means you’ve safely connected to the .gov website. Share
sensitive information only on official, secure websites.
This blog shows several different ways to visualize data from the tidycensus package for R.

Tips and example R scripts for converting long-formatted data into wide tabular format

Improve your functions with helpful dataframe evaluation patterns.

Using the tidycensus package to access and visualize American Community Survey (ACS) data.

Iterate your R code using the map() function from the purrr package.
Write functions in R that run better and are easier to understand.
Learn the ropes building your own functions in R using water data examples.
Submit to the river chlorophyll forecasting challenge, co-hosted by the USGS Water Mission Area and Ecological Forecasting Initiative.
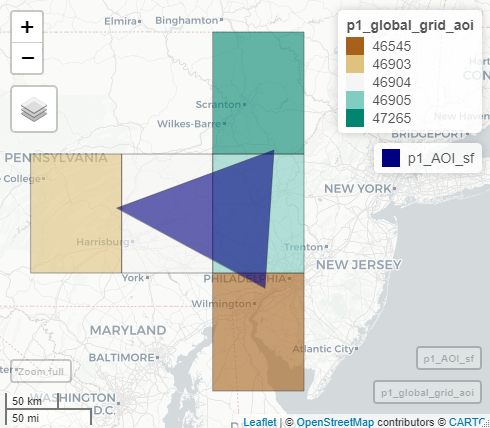
A pipeline-based approach for making large data pulls from Water Quality Portal
